AMD Radeon RX 7900 XT and 7900 XTX Review: Faster, but Is It Enough?
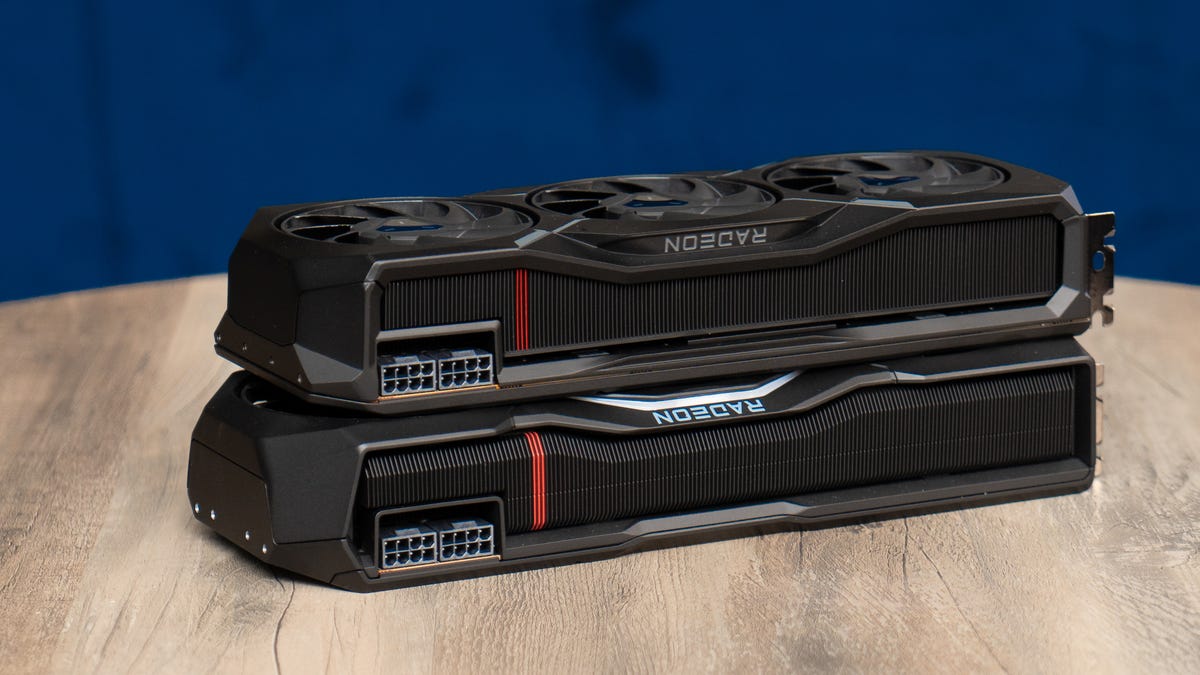
The Radeon RX 7900 XT (top) and 7900 XTX (bottom)
Lori Grunin/CNET
AMD’s latest top-end, next-gen gaming GPUs, which are based on its new RDNA 3 architecture, show marked improvement over the last generation. But the $899 Radeon RX 7900 XT and $999 Radeon RX 7900 XTX may only stand out at the moment because they’re cheaper than Nvidia’s latest top-end models, the GeForce RTX 4080 and 4090. And the XTX only occasionally hits the same level of performance in 4K as the RTX 4080 (or in some cases the RTX 3080 Ti).?
That price gap looks a lot more enticing in reality than on paper, however, because Nvidia’s RTX 4080 isn’t selling at its nominal price of $1,200. Cards at that price aren’t in stock, with most of the available models running closer to $1,500 or more.?
On the other hand, we won’t know what price AMD’s RX 7900 cards will settle on in reality until they’ve been out a while, making a price-to-performance comparison more difficult. If the gap sticks at $500, then dialing back your settings in order to get “good enough” 4K performance with the XTX in the games where it lags may be worth it. Both cards can handle 4K 1440p maxed out with ray tracing pretty well. But until we see the price and performance of whatever Nvidia turns its “unlaunched” lower-end model of the RTX 4080 into, it’s hard to determine the relative value of the 7900 XT for 4K or even 1440p.?
AMD Radeon RX 7900 XT
Like
- DisplayPort 2.1 support
- USB-C connector
Don’t Like
- Big for its performance level
- Disappointing raytracing performance
- Some driver issues
At least the two AMD-branded models are more similar than they are different. They have different specs and therefore different levels of performance, with concomitant physical differences to support that. Third-party cards will likely have a lot more variations.
The XTX does have an extra temperature sensor for monitoring the air intake temperature of the case, which is intended to facilitate dynamic power allocation based on cooling. AMD hasn’t yet made the data collected by the sensor available for anyone to use, though. ?
GPU specs
| AMD Radeon RX 7900 XTX | Radeon RX 7900 XT | |
|---|---|---|
| Memory | 24GB GDDR6 | 20GB GDDR6 |
| Memory bandwidth (GBps) | 960 (up to 3,500 with 96MB Infinity cache) | 800 (up to 2,900 with 80MB Infinity Cache) |
| GPU clock (GHz, base/boost) | 1.9/2.5 | 1.5/2.4 |
| Memory data rate/Interface | 20Gbps/384-bit | 20Gbps/320-bit |
| Compute units and Ray accelerators | 96 | 84 |
| Streaming multiprocessors | 6,144 | 5,376 |
| AI accelerators | 192 | 168 |
| Process | 5nm and 6nm | 5nm and 6nm |
| Board power/min PSU (watts) | 335/800 | 315/750 |
| Connectors | 2 x DP 2.1, 1 x HDMI 2.1, 1 x USB-C | 2 x DP 2.1, 1 x HDMI 2.1, 1 x USB-C |
| Bus | PCIe 4.0×16 | PCIe 4.0×16 |
| Size | 2.5 slots; 11.3 in./287mm long | 2.5 slots; 10.9 in./276 mm long |
| Launch price | $999 | $899 |
| Ship date | Dec. 13, 2022 | Dec. 13, 2022 |
Both cards are relatively big and heavy. In fact, the XTX is the first card I’ve tried to install where I’ve worried it might do some damage to the slot before I got it screwed in. It was fine once locked in, though.
Although they can work with eight-pin power connectors and fit into the same slot widths as before, the cards are higher than their predecessors, rising 5.3 inches (135 millimeters) above the motherboard (compared to 4.7 in. or 120 mm for the RX 6950 XT). So depending on your case size, they may be a snug fit. They do retain the USB-C port, which I like since desktops never have enough of them. But if you need a third full-size DisplayPort connector, you’ll have to join team Nvidia.
AMD Radeon RX 7900 XTX
Like
- DisplayPort 2.1 support
- USB-C connector
Don’t Like
- Big for its performance level and very heavy
- Disappointing ray tracing performance
- Some driver issues
RDNA 3 and performance
Among other things, RDNA 3 adds support for DisplayPort 2.1, which has the necessary bandwidth to support 165Hz at 8K and 12 bits per color (up from 10 bits) for HDR, and to enable full gamut coverage of Rec.2020, or up to 480Hz in 4K. That’s a link bandwidth of up to 54Gbps, up from 20Gbps in DP 1.4a, which Nvidia’s cards still use. I can’t imagine trying to play in 8K with one of these, but more bandwidth for HDR is always welcome.
RDNA 3 architecture improves on RDNA 2 in several ways. It’s the first GPU built from chiplets, the modular building blocks of modern processor design. That allows AMD to use different process sizes on the same die, in this case, a 5nm graphics core and 6nm memory cache die. This can theoretically result in the ability to optimize the performance of the two separately, to squeeze in more power or speed where it does the most good, and ultimately fit a better processor in the same space and power envelope as earlier models.
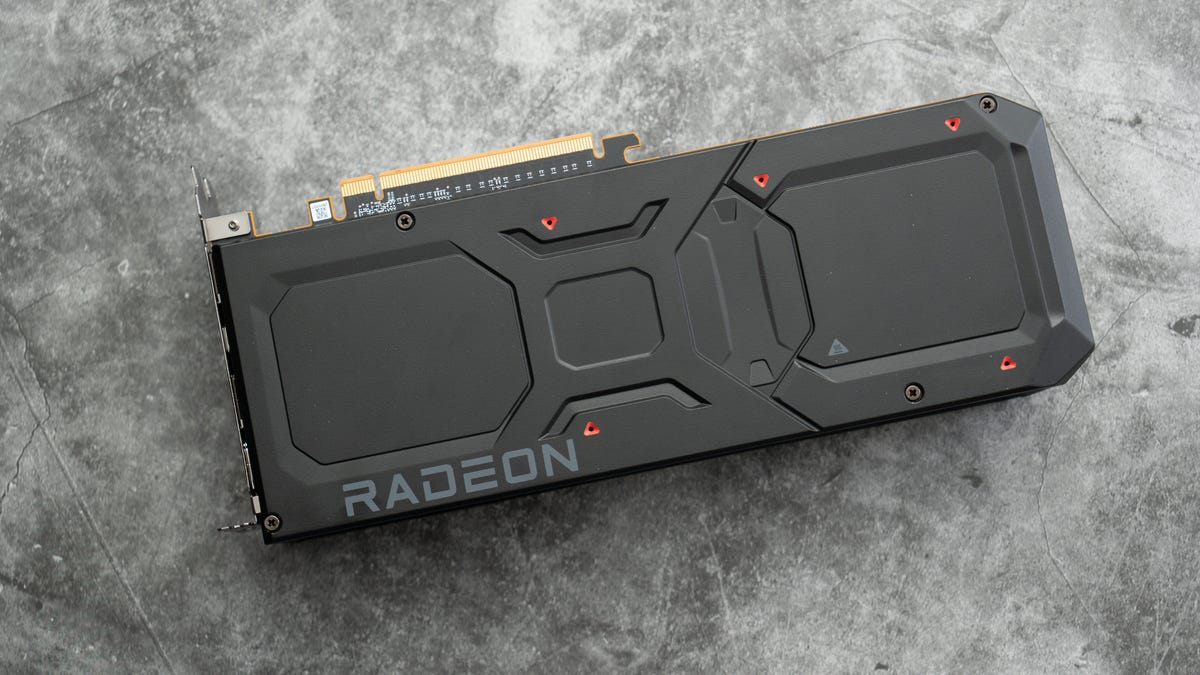
Both cards have a solid backplate rather than extra ventilation.
Lori Grunin
It also enables AMD to add dedicated AI acceleration and improved raytracing accelerators — unfortunately, not enough to catch up to Nvidia’s RTX and Tensor cores — and to decouple the memory clock speeds from the compute unit speeds to help conserve power draw.?
AMD says the GPU gets better DirectX raytracing performance, and it does. But AMD continues to seriously lag Nvidia in this respect. Neither card seems fast enough for 4K with maxed-out ray tracing like the RTX 4080, much less the RTX 4090. The XTX does match the RTX 4080 in 4K on some games without ray tracing, but for the most part, it varies across games and graphics applications.?
When you stick one of these cards into a late-generation AMD-based motherboard, SmartAccess Video joins the company’s other “smart” technologies, which include Smart Access Memory. In this case, when you have a system equipped with a Ryzen 7000 CPU and RX 7000 GPU, it can distribute encoding and decoding tasks between the two for better performance. (My current testbed is Intel. I’m building out an additional AMD testbed, but it’s not yet ready for benchmarking duties.)
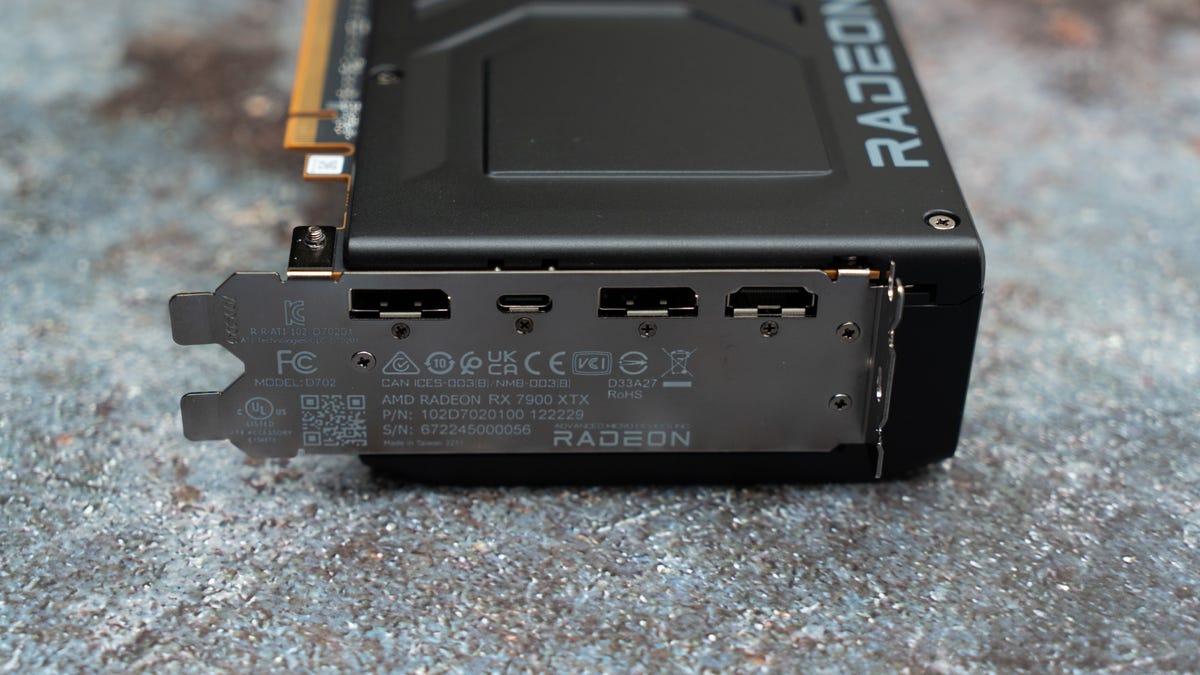
AMD retains the USB-C connector on its cards, unlike Nvidia.
Lori Grunin/CNET
It’s possible that AMD’s next generation of its upscaling and performance optimization technology, FidelityFX Super Resolution 3, will bump either or both the GPUs over the performance line without losing much detail, but that won’t be available for a while. FSR 2.2 has barely arrived — it’s only available in two games thus far, Forza Horizon 5 and Need for Speed Unbound — and I haven’t been overly impressed with FSR 2.1 when I’ve tried it.?
In Cyberpunk 2077, for example, unless I dropped the settings down to Balanced, I got no significant performance improvements. Even then it looked softer than I expect from 4K. Radeon Super Resolution, AMD’s in-driver equivalent that doesn’t require developer support, seemed to randomly fail to kick in, or at least fail to indicate it had, making it hard to judge.
Another still-to-come Adrenalin driver capability is Hyper-RX mode, a one-click optimizer for performance and latency that takes into account all the settings you’d normally have to hunt down and tweak individually. That capability is due in June, and it might make a notable difference, but I only occasionally saw a marked improvement using Rage mode, its current automatic overclocking feature.
I also encountered some type rendering issues in Microsoft Word and Outlook (although it’s probably the same bug for both), with characters disappearing and reappearing as I typed subsequent letters. Your mileage may vary, but it’s unbelievably annoying if you encounter it and use those applications a lot.
It’s hard to slot the AMD Radeon RX 7900 cards into any particular recommendation niche, at least until we’ve got more information on upcoming competitors, not only from Nvidia, but from AMD’s own line. So like a Magic 8 Ball I’m forced to settle on “Cannot predict now.”
Relative performance of recent GPUs
Shadow of the Tomb Raider gaming test (4K)
RTX 3080 Ti
97
RX 7900 XT
99
RX 7900 XTX
125
RTX 4080
134
RTX 4090
181
Note:
Longer bars indicate better performance (FPS)
3DMark Fire Strike Ultra
RTX 3080 Ti
12,635
RX 7900 XT
16,879
RTX 4080
17,619
RX 7900 XTX
19,760
RTX 4090
24,407
Note:
Longer bars indicate better performance
3DMark Time Spy (Graphics score)
RX 7900 XT
24,814
RTX 4080
28,275
RX 7900 XTX
29,413
RTX 4090
35,467
Note:
Longer bars indicate better performance
3DMark Speed Way (DX12 Ultimate)
RX 7900 XT
4,534
RX 7900 XTX
5,891
RTX 4080
7,168
RTX 4090
9,813
Note:
Longer bars indicate better performance
3DMark DXR (DirectX Ray Tracing)
RX 7900 XT
42.06
RX 7900 XTX
49.16
RTX 3080 Ti
54.96
RTX 4080
85.01
RTX 4090
136.05
Note:
Longer bars indicate better performance (FPS)
SpecViewPerf 2020 Medical (4K)
RTX 3080 Ti
22.28
RTX 4080
31.59
RTX 4090
43.22
RX 7900 XT
51.54
RX 7900 XTX
56.61
Note:
Longer bars indicate better performance (FPS)
SpecViewPerf 2020 SolidWorks (4K)
RX 7900 XT
165.46
RX 7900 XTX
184.8
RTX 3080 Ti
191.52
RTX 4080 FE
233.84
RTX 4090 FE
304.66
Note:
Longer bars indicate better performance (FPS)
Test PC configuration
| Custom PC | Microsoft Windows 11 Pro (22H2); 3.2GHz Intel Core i9-12900K; 32GB DDR5-4800; 2x Corsair MP600 Pro SSD; Corsair HX1200 80 Plus Platinum PSU, MSI MPG Z690 Force Wi-Fi motherboard, Corsair 4000D Airflow midtower case |
|---|